Basic Geography/Climate/Recording Weather
Appearance
Recording The Weather
[edit | edit source]Weather conditions are measured at weather stations. These stations contain a variety of instruments to record weather data.
The most important instruments of a weather station are:
- Hydrometer - Are a special type of thermometer that measures the humidity by calculating the water vapour in the air.

- Rain Gauge - This is a container that collects precipitation and measured it in millimeters (mm).
- Barometer - These instruments measures the air pressure. They may be either mercury or aneroid (vacuum) barometers. Often they are attached to a pen that charts movements in pressure on a piece of paper. The resulting chart is called a barograph.

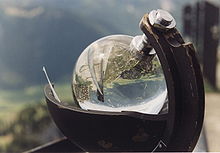
- Sunshine Recorder - The recorder is a chart which has the sun's rays focused onto it using a magnifying glass so it burns a record of the hours the sun shone.
- Maximum and minimum thermometers measure the highest and lowest temperature in degrees Celsius.
- Wind Vanes show the direction of the wind.
- Anemometers are used to measure wind speeds, usually in km/h. The wind is caught in small cups and the speed is calculated by measuring how fast the cups rotate.
Clouds
[edit | edit source]Recording cloud type and cloud-cover is done manually, using the naked eye. Meteorologists measure cloud-cover in eighths of the sky or oktas.
- 0 oktas = a completely cloudless sky
- 4 oktas = half the sky is covered in clouds
- 8 oktas = the sky is fully clouded-over
Mapping weather
[edit | edit source]The internationally agreed way in which to map the weather is by using synoptic charts. Data is collected across a large area from weather stations, balloons, ships, aeroplanes, and satellites. Informations on a synoptic chart is updated at least every six hours. The following information is displayed on a synoptic chart:
- temperature
- precipitation
- atmospheric pressure
- wind speed
- direction
- cloud coverage
