High School Earth Science/Topographic Maps
Lesson Objectives
[edit | edit source]- Describe a topographic map.
- Explain what information a topographic map contains.
- Explain how to read and interpret a topographic map.
- Explain how various earth scientists use topographic maps to study the Earth.
What is a Topographic Map?
[edit | edit source]Mapping is a crucial part of earth science. Topographic maps represent the locations of major geological features. Topographic maps use a special type of line, called a contour line, to show different elevations on a map. Contour lines are drawn on a topographic map to show the location of hills, mountains and valleys. When you use a regular road map, you can see where the roads go, but a road map doesn't tell you why a road stops or bends. A topographic map will show you that the road bends to go around a hill or stops because that is the top of a mountain. Let's look at topographic maps.
Look at this view of Bryce Canyon National Park, Utah (Figure 2.26). You can see the rugged canyon walls and valley below. The terrain clearly has many steep cliffs. There are high and low points between the cliffs.


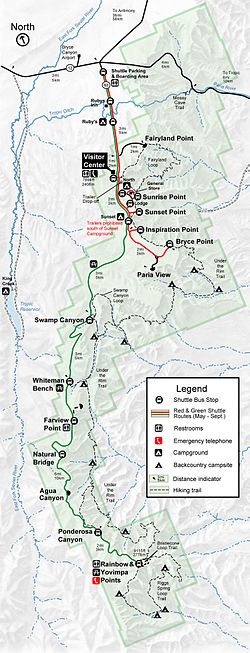
Now look at the corresponding section of the Visitor's map (Figure 2.27). You can see a green line which is the main road. The black dotted lines are trails. You see some markers for campsites, a picnic area, and a shuttle bus stop. But nothing on the map shows the height of the terrain. Where are the hills and valleys located? How high are the canyon walls? Which way will streams or rivers flow?
You need a special type of map to represent the elevations in an area. This type of map is called a topographic map (Figure 2.28).
What makes a topographic map different from other maps? Contour lines help show various elevations.

Contour Lines and Intervals
[edit | edit source]Contour lines connect all the points on the map that have the same elevation. Let's take a closer look at this (Figure 2.28).
- Each contour line represents a specific elevation and connects all the places that are at the same elevation. Every fifth contour line is in bold. The bold contour lines are labeled with numerical elevations.
- The contour lines run next to each other and NEVER cross one another. That would mean one place had two different elevations, which cannot happen.
- Two contour lines next to one another are separated by a constant difference in elevation (e.g. 20 ft or 100 ft.). This difference between contour lines is called the contour interval. You can calculate the contour interval. The legend on the map will also tell you the contour interval.
- Take the difference in elevation between 2 bold lines.
- Divide that difference by the number of contour lines between them, PLUS 1. To put it another way:
If the difference between two bold lines is 100 feet and there are four lines between them, what is the contour interval? If you answered 20 feet, then you are correct, 4+1=5, right? So, the calculation would be: (100 ft/5 = 20 ft).
Interpreting Contour Maps
[edit | edit source]How does a topographic map tell you about the terrain? Well, in reading a topographic map, consider the following principles:
- Contour lines can indicate the slope of the land. Closely-spaced contour lines indicate a steep slope, because elevation changes quickly in a small area. In contrast, broadly spaced contour lines indicate a shallow slope. Contour lines that seem to touch indicate a very steep or vertical rise, like a cliff or canyon wall. So, contour lines show the three-dimensional shape of the land. For example, on this topographic map of Stowe, Vermont (Figure 2.29), you will see a steep hill rising just to the right of the city of Stowe. You can tell this because the contour lines there are closely spaced. Using the contour lines, you can see that the hill has a sharp rise of about 200 ft and then the slope becomes less steep as you proceed right.

Figure 2.29: Portion of a USGS topographic map of Stowe, VT. In this map, you can see how the spacings of the contour lines indicate a steep hill just to the right of the city of Stowe in the right half. The hill becomes less steep as you proceed right. - Concentric circles indicate a hill. Figure 2.30 shows another side of the topographic map of Stowe, Vermont. When contour lines form closed loops all together in the same area, this is a hill. The smallest loops are the higher elevations and the larger loops are downhill. If you look at the map, you can see Cady Hill in the lower left, and another smaller hill in the upper right.

Figure 2.30: Portion of a USGS topographic map of Stowe, VT. In this map, you can see Cady Hill (elevation 1122 ft) indicated by concentric circles in the lower left portion of the map and another hill (elevation ˜ 960 ft) in the upper right portion of the map. - Hatched concentric circles indicate a depression. The hatch marks are short, perpendicular lines inside the circle. The innermost hatched circle would represent the deepest part of the depression, while the outer hatched circles represent higher elevations.
- V-shaped portions of contour lines indicate stream valleys. Here the V- shape of the contour lines “point” uphill. The channel of the stream passes through the point of the V and the open end of the V represents the downstream portion. Thus, the V points upstream. A blue line will indicate the stream if water is actually running through the valley; otherwise, the V patterns will indicate which way water will flow.
- Like other maps, topographic maps have a scale on them to tell you the horizontal distance. The horizontal scale helps to calculate the slope of the land (vertical height/horizontal distance). Common scales used in United States Geological Service (USGS) maps include the following:
- 1:24,000 scale – 1 inch = 2000 ft
- 1:100,000 scale – 1 inch = 1.6 miles
- 1:250,000 scale – 1 inch = 4 miles
So, the contour lines, their spacing intervals, circles, and V-shapes allow a topographic map to convert 3-dimensional information into a 2-dimensional representation on a piece of paper. The topographic map gives us an idea of the shape of the land.
How Do Earth Scientists Use Topographic Maps?
[edit | edit source]
Earth scientists use topographic maps for many things:
- Describing and locating surface features, especially geologic features.
- Determining the slope of the Earth's surface.
- Determining the direction of flow for surface water, ground water, and mudslides.
Hikers, campers, and even soldiers use topographic maps to locate their positions in the field. Civil engineers use topographic maps to determine where roads, tunnels, and bridges should go. Land use planners and architects also use topographic maps when planning development projects like housing projects, shopping malls, and roads.
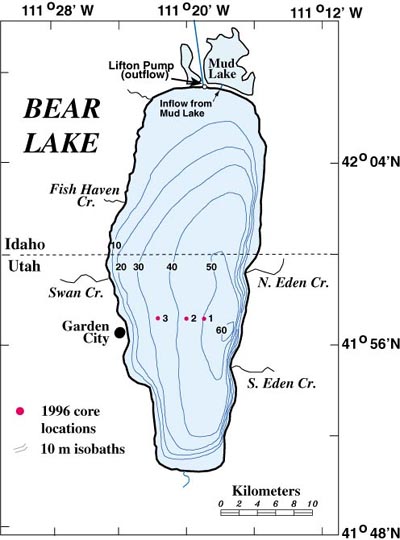
Oceanographers use a type of topographic map called a bathymetric map (Figure 2.31). In a bathymetric map, the contour lines represent depth from the surface. Therefore, high numbers are deeper depths and low numbers are shallow depths. Bathymetric maps are made from depth soundings or sonar data. Bathymetric maps help oceanographers visualize the bottoms of lakes, bays, and the ocean. This information also helps boaters to navigate safely.
Geologic Maps
[edit | edit source]A geologic map shows the geological features of a region. Rock units are shown in a color identified in a key. On the map of Yosemite, for example, volcanic rocks are brown, the Tuolumne Intrusive Suite is peach and the metamorphosed sedimentary rocks are green. Structural features, for example folds and faults, are also shown on a geologic map. The area around Mt. Dana on the east central side of the map has fault lines.


Lesson Summary
[edit | edit source]- Topographic maps are two-dimensional representations of the three-dimensional surface features of a given area. Topographic maps have contour lines which connect points of identical elevation above sea level.
- Contour lines run next to each other and adjacent contour lines are separated by a constant difference in elevation, usually noted on the map. Topographic maps have a horizontal scale to indicate horizontal distances. Topographic maps help users see how the land changes in elevation.
- Many people use topographic maps to locate surface features in a given area, to find their way through a particular area, and to determine the direction of water flow in a given area.
- Oceanographers use a special type of topographic map called a bathymetric map, which shows the bottom of any given body of water.
- Geologic maps display rock units and geologic features of a region of any size. A small scale map displays individual rock units while a large scale map shows geologic provinces.
Review Questions
[edit | edit source]- On a topographic map, you see contour lines forming closed loops that all lie in the same area. Which of the following features would this indicate?
- a stream channel
- a hilltop
- depression
- a cliff
- Describe the pattern on a topographic map that would indicate a stream valley. How you would determine the direction of water flow?
- On a topographic map, five contour lines are very close together in one area. The contour interval is 100 ft. What feature does that indicate? How high is this feature?
- On a topographic map, how can you tell a steep slope from a shallow slope?
- On a topographic map, a river is shown crossing from Point A in the northwest to Point B in the southeast. Point A is on a contour line of 800 ft and Point B is on a contour line of 900 ft. In which direction does the river flow? What information would help you figure this out?
- On a topographic map, six contour lines span a horizontal distance of 0.5 inches. The horizontal scale is 1 inch equals 2000 ft. How far apart are the first and sixth lines?
- On a geologic map of the Grand Canyon, a rock unit called the Kaibab Limestone takes up the entire surface of the region. Down some steep topographic lines is a very thin rock unit called the Toroweap Formation and just in from that is another thin unit, the Coconino sandstone. Describe how these three rock units sit relative to each other.
Vocabulary
[edit | edit source]- bathymetric map
- A special type of topographic map used by oceanographers that shows depth of areas underwater.
- contour interval
- The constant difference in elevation between two contour lines on a topographic map.
- contour lines
- Lines drawn on a topographic map to show elevation; these lines connect all the places that are the same elevation.
- topographic map
- A special type of map that show elevations of different geologic features of a region.
Points to Consider
[edit | edit source]- Imagine that you are a civil engineer. Describe how you might use a topographic map to build a road, bridge, or tunnel through the area such as that shown in Figure 2.30. Would you want your road to go up and down or remain as flat as possible? What areas would need a bridge in order to cross them easily? Can you find a place where a tunnel would be helpful?
- If you wanted to participate in orienteering, would it be better to have a topographic map or a regular road map? How would a topographic map help you?
- If you were the captain of a very large boat, what type of map would you like to have to keep your boat traveling safely?


