Signals and Systems/Bode Plots
Frequency Response Plots
[edit | edit source]The frequency response is a complex function of the radial frequency
or of the variable
These functions give the relation between the input and the output of a linear, time invariant system. A frequency response is found in the form of a ratio of two polynoms:
The zeros of the numerator are called the zeroes of the transfer function. The zeros of the denominator are called the poles of the transfer function. Both zeroes and poles are either real or complex conjugates.
The transfer function of a system with only complex conjugate zeroes, and , and poles and , can be written as:
If there is a real zero, , and a real pole, , the transfer function becomes:
The frequency response is usually represented as a combination of two plots: the amplitude response and the phase response.
Bode Plots
[edit | edit source]Bode plots represent the amplitude and the phase responses with a logarithmic scale for both the frequency and the amplitude.
The frequency axis shows . The span between two frequencies having a ratio of 10 is referred as a decade.
The amplitude axis shows which is the amplitude in decibel.
This representation has the advantage that the effect of the real zeroes, real poles, conjugate zeroes pairs and conjugate pole pairs add-up in the representation.
Example: 3rd Order Butterworth Filter
[edit | edit source]
A third order Butterworth filter has 3 poles: one real and two complex conjugates. All poles are regularly spaced on the left hand side of a circle.
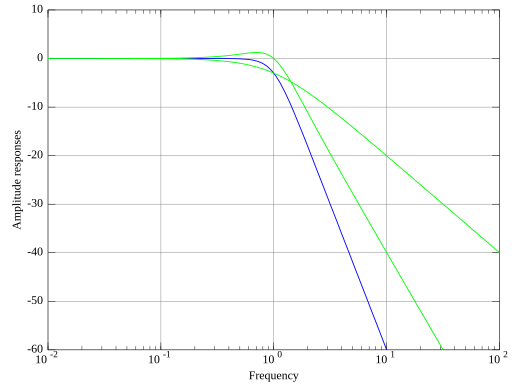
The following amplitude plot shows in green:
- the response of the real pole which decays from the 1 Hz cutoff frequency with a slope of -20 dB/decade
- the response of the conjugate pole pair which decays with a slope of -40 dB/decade
The filter response is shown in blue. It decays with a slope of -60 dB/decade.
In the Bode plot, the overall amplitude response (in blue) can be drawn as the sum of all the amplitude responses of the real poles or conjugate pole pairs (in green).
The following phase plot shows in green:
- the phase response of the real pole which shifts of at the 1 Hz cutoff frequency
- the phase response of the conjugate pole pair which shifts of
The filter phase response is shown in blue. It shifts of .
In the Bode plot, the overall phase response (in blue) can be drawn as the sum of all the phase responses of the real poles or conjugate pole pairs (in green).
So knowing the responses of each in individual real pole and complex conjugate pole pairs allows to draw the overall amplitude and phase responses.


