Statistics/Displaying Data/Scatter Graphs
Appearance
Scatter Plots
[edit | edit source]
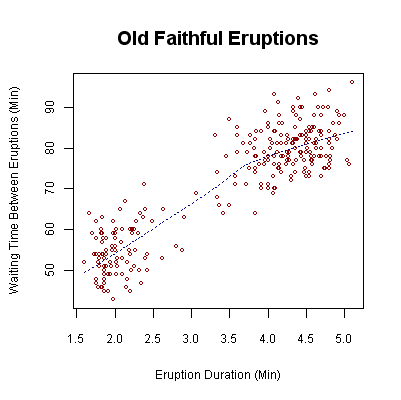
Scatter Plot is used to show the relationship between 2 numeric variables. It is not useful when comparing discrete variables versus numeric variables. A scatter plot matrix is a collection of pairwise scatter plots of numeric variables.
External Links
