Structural Biochemistry/Organic Chemistry/Methods of Identification
Thin-layer Chromatography
[edit | edit source]
Thin-layer chromatography (TLC) is useful for determining the composition of compounds in a mixture and also for distinguishing two compounds from one another. In TLC, glass, metal, or plastic plates coated with a thin layer of adsorbent serve as the stationary phase and a pure solvent or mixture of solvents act as the mobile phase. Most nonvolatile solid organic compounds can be analyzed by TLC. To carry out a TLC experiment, a small amount of the mixture being separated is dissolved in a suitable solvent and applied or spotted on the adsorbent near one end of a TLC plate. The plate is then placed in a closed chamber with the edge nearest the applied spot immersed in a shallow layer of the mobile phase called the developing solvent. The solvent is then allowed to rise through the stationary phase by capillary action. As the solvent ascends the plate, the sample is distributed between the mobile and stationary phase, separating as a result of the different polarities between both the phases and the compounds being separated. The more polar a compound is, the more tightly it binds to the adsorbent, and the more slowly it moves on the TLC plate. The developing solvent moves nonpolar substances up the plate most rapidly and polar substances travel up more slowly. The TLC plate is then removed when the solvent front is about 1 cm from the top and its position is marked. The Rf (Retention front or Ratio to front) can be calculated based on how much the compound moves up the plate when compared to the baseline. Rf = distance compound traveled / distance solvent front traveled. The range of this value can go from 0 to 1. An Rf of 0.2 is generally desirable. However, this value can be adjusted by changing the polarity of the solvent used during the mobile phase. The plate is then dried in a fume hood and visualization methods are used to analyze the plates.
To better understand the general principles underlying this process, it is helpful to scale up thin-layer chromatography to sizes of objects we see very often.
Imagine:
Stationary phase as the beach
Mobile phase as waves that wash up to the shore and return back to the sea.
Compounds as people of different mass
Initially, two people of differing mass are sitting at the same position on the beach. As the waves wash up to their position, it will pull in the lighter person closer into the sea. As time goes on, the lighter person will be distanced from the heavier person due to their differing attraction to the sand. The distance they have traveled from their initial location are distinct and serve as a characterization and separation factor of the two individuals. Although in thin-layer chromatography, the mobile phase moves in one direction and the compounds do not differ necessarily by mass but by their differences in affinity to the stationary phase and mobile phase, this example is helpful to picture the general idea of this important process for the identification and separation of mixed compounds.
TLC plate Composition and Preparation
[edit | edit source]Solid supports to which the stationary phase is bound onto can be made up of glass, plastic, or aluminum sheet. The most common compound used to make the stationary phase is silica gel. Since it is porous, it has a large surface area which facilitates in desirable extensive interactions with compounds. The stationary phase must be bound onto the chosen solid support. This is done by mixing the silica gel with compounds which aid the silica gel particles in adhering to the solid support. The prepared mixture is then spread onto the solid support and allowed to dry.
Visualization Methods for TLC
[edit | edit source]There are two simple and basic methods of visualize, fluorescence and Iodine visualization. Fluorescence involves the use of adsorbents that contain a fluorescent indicator. The insoluble inorganic indicator is then detected when the outputs from a short-wavelength ultraviolet lamp are used to illuminate the adsorbent side of the plate in a dark box. The separated compounds appear as dark spots on the florescent field because the substances forming the spots usually quench the fluorescence of the adsorbent. These spots can later be analyzed. Another way to visualize colorless organic compounds is to use their adsorption of Iodine vapor. This is done by placing the plate in a bath of iodine vapor. Colored spots are gradually produced from the reaction of the substances with iodine vapor. The spots are dark brown on the white to tan background. After 10–15 minutes, the plate can be removed and the spot should be outlined with a pencil as the spot often disappears before being analyzed later.
Gas Chromatography
[edit | edit source]
Gas Chromatography (GC) can quickly assess the purity of a compound but cannot identify a compound by its own unless a known same is available to use as a standard. By comparing retention times, peak enhancements, and chromatogram, the identity of the components of the mixture can be determined. GC is very useful for quantitative analysis of a component mixture as a comparison of relative peak areas on the chromatogram often gives a good approximation of relative amounts of each compound.
Gas chromatography works by essentially having two phases work with each other. The mobile phase, in other words a 'moving phase', is carried out but a inert gas such as helium or an nonreactive gas such as nitrogen. The stationary phase is a microscopic layer of liquid or polymer that is supported by an inert solid that is placed inside a piece of glass tubing which is called a column. The gaseous compounds being analyzed in the mixture dispensed interact with the walls of the column that is coated with a stationary phase. Because of different polarity and affinities that various compounds display with the stationary phase, a retention time is calculated based on how long the compound spends time binding to the stationary phase while the mobile phase moves up the stationary phase. The various compounds continuously bind back and forth to the stationary phase and the mobile phase and are separated by the various strength in intermolecular interactions they share with the stationary phase. It the comparison of the retention times between compounds that displays the efficiency and application to the gas chromatographer.
Infrared Spectroscopy
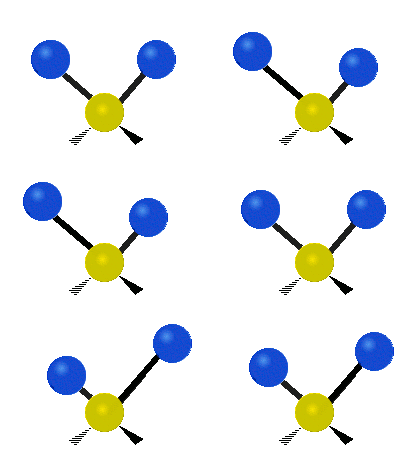
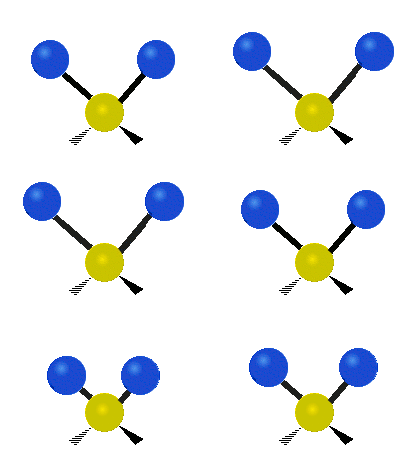
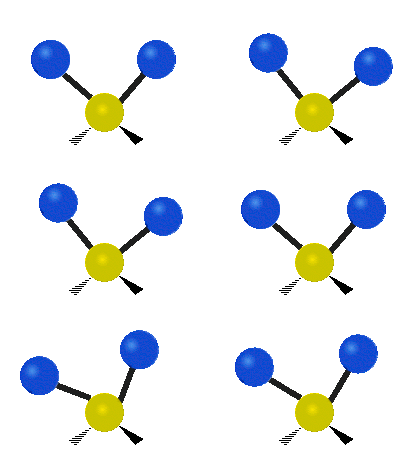
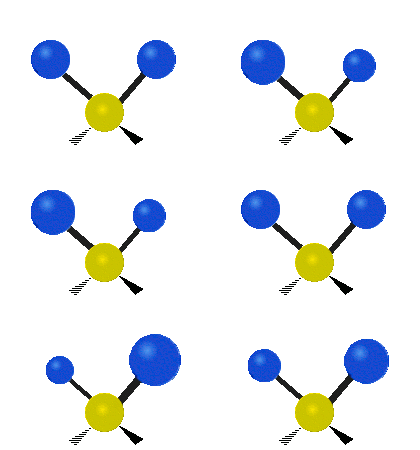
[edit | edit source]Infrared spectroscopy is one of the most useful spectroscopic techniques in organic chemistry because it is a rapid and effective method for identifying the presence or absence of simple functional groups within a compound. When IR energy is passed through a sample, absorption bands are observed and these bands are then correlated with types of chemicals bonds which can provide important information about the nature of functional groups in the sample. An IR spectrum has energy measured as frequency of wavelength against intensity of the absorption. This is the result of molecular vibrations. The atoms making up a molecule are in constant motion and the movements of the atoms relative to each other can be described as vibration. The photons of IR radiation absorbed by an organic compound have just the right amount of energy to stretch or bend its covalent bond. An absorption band appears in an infrared spectrum as a result of this vibration. These bands are affected by different vibration modes of the compound, its polarity, as well as its bond order.There are different types of vibration modes at a tetrahedral carbon. They are stretching, bending, scissoring, rocking, twisting, and wagging. For stretching, it can be either symmetric or asymmetric.
Asymmetrical Stretching
Symmetrical Stretching
Bending
Scissoring
Twisting
Wagging
Information on how an IR spectrum comes to be The mid infrared is the region that provides the most information to organic chemists. The region spans from 4000 cm-1 to 600 cm-1. This region is where the absorptions of most of the simple functional groups of organic molecules appear. An IR spectrum plots the wavenumber (inverse of frequency) of a functional group against the intensity of the absorption. This is done by running a sample of interest in an infrared spectrometer and when a certain functional group is recognized, a peak will appear on the spectrum. The wavenumber corresponds to the frequency in which the functional group absorbs energy and the intensity measures how strongly the function group is absorbed. Since the atoms that make up a molecule are in constant motion, they are said to “vibrate.” When these groups absorb the right amount of energy from the photons they are hit with, the molecules will gain enough energy to stretch or bend their covalent bonds. Stretching and bending are two different types of vibration. The energy levels of the molecular vibrations of a molecule are quantized, meaning that vibrations will only occur if the infrared energy matches the frequencies of the molecular vibrations exactly. If the energy does not match, no absorption will occur. Thus, if a function group is not present, there will be no absorption peak on the IR spectrum, making IR spectroscopy a very powerful tool in identifying function groups in a molecule. In addition, bond order can give additional insight into where certain peaks can appear in an IR spectrum. Bond order is the amount of bonding that occurs between two molecules. The bond order between carbon atoms increase as one moves from an alkane to an alkene to an alkyne. The bond order increases with the number of bonds between the two bonding atoms. The higher the bond order of the atoms, the higher the wavenumber the molecule absorbs at, and the greater the energy needed to produce a stretching vibration. Atomic mass also provides information as to the location of the absorption of certain molecules on the IR spectrum. The larger the atomic mass of the vibrating atoms, the higher frequency and the more energy it takes to stretch the bonds of molecule.
Identifying function groups on an IR spectrum After many experiments done with an IR spectrometer, scientists have found regions in which the stretching of certain function groups and bonds occur. An table is shown below:
| Bond or functional group | Wavenumber (cm−1) |
|---|---|
| RO — H (alcohols) | 3200 - 3650 |
| RC(=O)O — H (carboxylic acid) | 2500 - 3300 |
| R2N — H (amines) | 3250 - 3500 |
| RC=C — H (alkynes) | 3260 - 3330 |
| C=C — H (alkanes) | 2840 - 3000 |
| C—H (alkanes) | 2840 - 3000 |
| RC=CH (alkynes) | 2100–2260 |
| RC=CN (nitriles) | 2220–2260 |
| RC(C=O)H (aldehydes, RC(C=O)R’ (ketones) |
1690–1750 |
| RC(C=O)OR’ (esters) | 1735–1750 |
| RC(C=O)OH (carboxylic acid) | 1710–1760 |
| -C=C- (alkenes) | 1620–1680 |
| RC — OR’ (esters, alcohols) | 1000–1260 |
Of the wavenumbers that each functional group can be absorbed at, there are three distinct regions: a functional group region, fingerprint region, and aromatic region. The function group region is between 4000 – 1500 cm-1¬, in which most of the peaks of the major function groups appear. The fingerprint region is between 1500 – 900 cm-1, where many of the bending vibrations appear. It is not as important as the functional group region, but gives you a region to confirm the presence of a certain bond if you are uncertain. The last region, which is between 900 – 600 cm-1, provides information about the presence of aromatic compounds, such as benzenes.
IR spectroscopy alone is not enough to determine the structure of a molecule. It must be coupled with NMR spectroscopy to produce information for structure identification.
Below are some IR spectra for the presence of certain function groups.
IR of an alcohol:
(large wide peak between 3200 – 3400)
IR of a carbonyl group:
(strong peak around 1700)
Nuclear Magnetic Resonance
[edit | edit source]NMR is one of the most important tools for analysis in organic chemistry and biochemistry. In comparison to other protein-determining techniques, NMR can be advantageous because it analyzes the structure of macromolecules in solution. Other techniques, such as x-ray crystallography, requires macromolecules to be crystallized. NMR is also very useful in that it can show the dynamic side of protein structure, revealing details regarding conformational changes, folding, and interactions with other proteins. NMR technique uses low energy radiation within the radio frequency range. The radiation excites atomic nuclei, however only certain specific isotopes are excited; most commonly 1H and 13C. These atomic nuclei can be modeled as spinning around an axis, this property is known as nuclear spin. Since hydrogen is essentially a proton, its spinning motion creates a magnetic field. For all intents and purposes, the hydrogen can be imagined to be synonymous with a magnet floating freely in space.
When these atomic nuclei are excited by an external magnetic field, they can have one of two orientations, an alpha or beta spin state. These nuclei, 1H and 13C, can be taken as tiny atomic magnets that can align with (alpha) or against (beta) the magnetic field. Alpha being more energetically favorable, and beta being a high energy state. Radiating a sample at just the right frequency to flip between alpha and beta spin states, creates resonance; in which the sample absorbs energy to flip to the beta spin state. After excitation the nuclei return to their original state, so at resonance the nuclei are constantly switching spin states. Nuclei in the beta state give off energy when relaxing to the alpha state. The resonance frequency at which this happens is proportional to how strong the external magnetic field is. The resonance frequency changes from nuclei to nuclei based upon the properties of its nucleus and environment.
Hydrogen (1H) NMR
[edit | edit source]Resonance frequencies largely depend on the polarity of bonds, the hybridization of attached atoms, and the presence of electron donating or withdrawing groups. When hydrogen is near an electron withdrawing group, such as chloromethane, the hydrogens are said to be deshielded because the polarity of the bonds pulls the hydrogens' electron cloud away from the nuclei. The opposite is known as shielding. These two phenomenon cause different hydrogens to have different resonance frequencies, and therefore different peaks. A peak is said to be at high field, or shifted right when the corresponding nuclei is shielded, and low field, or shifted left when the nuclei is deshielded.

From the example NMR above, you can see how the shielding and deshielding affect the peaks. The "C" group hydrogen, is far left because it is deshielded by the carbonyl group. The "B" group hydrogens are slightly less deshielded due to the aromaticity, and the "A" group hydrogens are barely deshielded at all.
1H NMR Hydrogen Nuclear Magnetic Resonance is one of the most used NMR since 1H has a nuclear spin. It is positively charged. When it spins, it creates a magnetic field. When an external magnetic field is added, the proton can either have a or B spin. The energy difference between these two states generates resonance. Different atom have different strength of the applied magnetic field. (CH3)4Si is used as a standard. the distance between the frequency of an atom to the frequency of (CH3)4Si is called chemical shift.
Chemical Shift = (distance of peak from (CH3)4Si in Hertz) / ( spectrometer frequency in megahertz) ppm
Here are some examples of commonly used chemical shifts:
Primary alkyl: 0.8-1.0 ppm
Secondary alkyl: 1.2-1.4 ppm
Tertiary alkyl: 1.4-1.7 ppm
Terminal alkene: 4.6-5.0ppm
Internal alkene: 5.2-5.7ppm
Alkyne: 1.7-3.1ppm
Alcohol: 0.5-5.0 ppm
Aromatic: 6.0-9.5ppm
It should be noted that the NMR spectra for the OH functionality of alcohols, the SH functional group of thiols, and the NH2 group of amines possess characteristically broad peaks.
Hydrogens that are in different chemical environments (meaning they have different atoms attached to them thus have different bond strengths and lengths that change how electrons "gather" around them) give different chemical shifts. An environment that is electron poor is considered deshielded and gives low field absorptions (farther to the left in the spectrum). In contrast, an electron rich enviornment is shielded and results in high-field peaks (farther to the right). Equivalent hydrogens give the same signal. Compounds have the same environment if they have the same connectivity and bond strengths/lengths. for example a molecule of benzene has 6 different hydrogens but they are all in the same environment.

It is important to know how to distinguish the equivalence of hydrogen in order to read the 1H NMR. This could be easy to spot like the electronegativity of the atoms around the nucleus of interest (hydrogen in this case), but the changes could be more subtle like symmetry in the molecule that makes some hydrogens equivalent. For this, the molecule phenol will be shown.

Although the hydroxyl group does change the shielding of the hydrogens there are only three different hydrongens. The ones right next to the OH group are both similar by connectivity but also by symmetry. The line of symmetry makes them alike since nature knows not of right and left. H's connected to the same carbon usually have the same shift but not all the time. if no symmetry can be assessed than the hydrogens are completely different. Besides this, there is another hint that 1H NMR gives us to help us to deduce the structure of a compound. It is the integration. By comparing the relative areas under the peaks, the ratio of hydrogens can be determined. We can find the relative number of hydrogens by looking at integration. Also, by looking at the splitting, we can find the neighboring hydrogens. The interaction of hydrogens with each other interrupts their magnetic field, thus affecting the shape of their peaks. One sharp peak is called singlet; One of the two-peak set is called doublet; One of the three-peak set is called triplet; One of the four-peak set is called quartet and etc. It follows the n + 1 rule. For instance, if we see one peak, there are no hydrogens attached to the atom next to the atom bonding to the hydrogen. If we see a doublet, that means the neighboring atom of the carbon that this hydrogen or these equivalent hydrogens are attached to has one hydrogen attached to it because the hydrogen affected the peak.
Carbon (13C) NMR
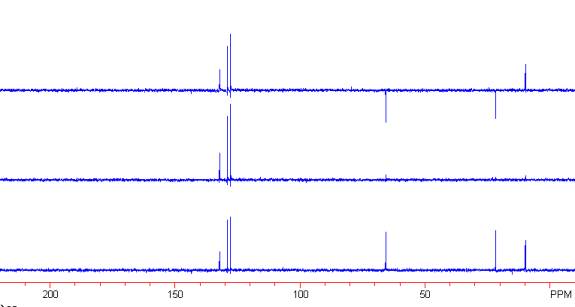
[edit | edit source]Carbon has the same idea as 1H NMR but 12C does not respond to NMR so the less abundant 13C is what will show up in the NMR spectra. Only about 1% of the carbon present in molecules is 13C and thus the peaks are not as intense as 1H. This lack of abundance is key because now carbons are not affected by the neighboring carbons because the chances of having two 13C atoms next to each other very unlikely. This is actually quite helpful because if there was more 13C not only would there be a disturbances in the 13C NMR but also in the 1H NMR and this would complicate NMR Spectra. The only thing that changes the peaks are the neighboring hydrogens. The same idea applies as in 1H with respect to singlets, doublets, triplets, etc.

Mix Melting Point
[edit | edit source]The identity of an unknown crystal can be determined by using the process of mix melting point. Mix melting point involves mixing equal amounts of the unknown crystals and another compound of a known melting point. Firstly, the melting point of the unknown crystal is determined; then, one can perform a mix melting point with a compound of known melting point that is closest to that of the unknown crystal. A mixture of the unknown and the known of equal amounts will be grounded together with a spatula and inserted into a capillary tube. Then, the mixture is inserted into a melting point apparatus for the determination of its melting point. In this situation, the unknown is acting like an impurity to the known compound. Impurities generally lower the melting point of the known crystals. A different melting point is observed when two different crystals are mixed because mixing two different compounds will disrupt the crystal lattices of the crystals affecting its physical properties such as melting point. One compound has acted as an impurity toward the other by lowering its melting point. If the melting point of this mixture is identical to that of the known, the mixture is made of two identical compounds meaning the unknown and the known are of the same identity since the same compound cannot act as an impurity to itself.
Example: If the unknown compound(might not be a pure compound) is determined to have a melting point of 110°C, now choose a known compound of the closest melting point to that of the unknown. In this case, it would be fluorine and perform a mix melting point with the unknown. known Compound and Melting Point (Celsius) Benzil – 95 Fluorene-114 9 Fluorenone-84 Unknown+ Fluorene- 112°C
Just in case, perform a mix melting point of the unknown with another known compound, the one which has the 2nd closest melting point next to the unknown, which is benzil. A quick mix melting point shows that a mixture of the two melts nowhere close to the 110s°C range, which rules out benzil as the unknown. Therefore, the unknown compound in this example is determined to be fluorene as the mix melting of the mixture is virtually the same as that of the unknown. Melting point is also crucial is determining the purity of a compound. For instance, if a known compound is pure, the melting point of this known can be used as a standard for measuring purity. By comparing the melting point of this pure compound to a sample compound of the same identity, one can determine the sample compound’s purity. The closer the sample’s melting point is to that of the pure compound, the more pure a sample is. This is because the purer the sample the less impurities. As we discussed earlier, the more impurities that are in a compound lead to decreasing the melting point. Therefore the same compound with the highest melting point is the purest also.
Melting point determinations are done using a melting point apparatus. The compound is loaded into a melting point capillary tube that is closed on one side. Usually some tapping is required to get the compound to the bottom of the tube. After the tube is loaded into the melting point apparatus, heat is applied gradually and the compound will start melting. The experimenter is able to track the progress of the melting by viewing the compound through a scope. The melting point determination apparatus provides an easy and quick way to determine the purity, and identity of a sample! [1]
References
[edit | edit source]Mohrig, Jerry R. Techniques in Organic Chemistry. 2006, W.H. Freeman and Company
Organic Chemistry Lab, Chemistry 143A
Shore Vollhardt. Organic Chemistry, Structure and Function, 5th Edition. W.H. Freeman and Company. New York.
- ↑ melting point, October 28, 2012
Ternansky, Robert. "Experiment 4a-b" CHEM 143A Lecture. University of California, San Diego, La Jolla. 03 Feb. 2012. Lecture.

