The Computer Revolution/E commerce/Flowchart
Flowchart is used to design a Web site. It describes how the pages in the site relate to one another. A web site flowchart is essentially a map of the structure of the Web site. It uses single boxes to represent each Web page, and the lines between the boxes show the logical organization of the site. You can link pages in any way you like, and visitors may visit the pages of the site in any order. Although the lines between the flowchart boxes indicate necessary hyperlinks, typically there are additional links between the pages. It is best to place links to the main pages of the site in a navigation bar on all pages of the site. More complex flowcharts show the logical steps and sequence of a multimedia component.
Creating a flowchart using Visual Logic
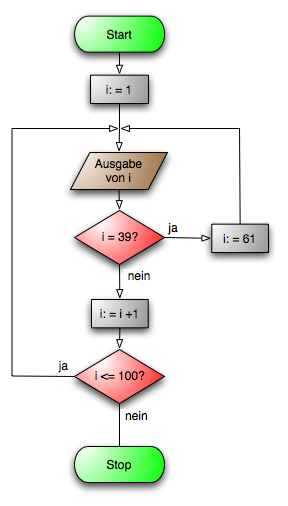
[edit | edit source] When you click on the arrow you get the option of different boxes that can be added to the flow chart. You can add different input/data boxes also. Input boxes help to put the value to the flowchart. The assignment box helps to calculate the value and provide the result. The result will go direct to the output box and when we run the program it will display the result in an output box. The diamond shape box indicates the branch in a process flow. The oval shape box indicates the start and the end of the process. Step one is hover your cursor over the red arrow until it turns green, then you right click to open the symbols box. Select the output symbol then double click it to add words you want to appear. Once you’ve typed for example your name you must be sure to use quotes.
You can then add as many output boxes as you want. To input spacing you need to double click the input box choose more then choose console. You will then see a symbol that resembles a dollar sign, hit enter before this symbol, close this box and click the arrow or F5 to view the output.
.
