Transportation Deployment Casebook/Go-To Card Fare Technology at Metro Transit
Qualitative Assessment
[edit | edit source]Description and Advantages of Go-To Technology
[edit | edit source]Go-To Card technology includes a no-contact system of on-board validators, hand-held validators, wireless communication, and smart cards. Contactless smart card systems are generally thought to be easier to use and to provide for faster fare payment allowing for reduced dwell time and more efficient transit service.[1] In addition, the use of smart cards as a method of fare payment results in vast collections of data available for use by transit agencies. Research conducted in the use and analyses of fare card data has resulted in several methodologies for determining origin destination matrices and itineraries of users of the transit system as well as other informative data used to evaluate transit systems. One such method, the boardings-alightings symmetry method, was developed in Los Angeles and based on the assumption that passengers will reenter at their most recent exit location.[2] Another method involves a detailed time analysis following the assumption that passengers will take the trip with the most utility after the time they enter the system and before they exit.[3] The appropriate analysis of Metro Transit smart card data could produce valuable insights for the systems planners and managers. For example it could be used in the justification of frequency adjustments along specific routes or the addition of new routes which provide better utility between popular origins and destinations. In addition to the advantages noted above typical Go-To cards, see Figure 1, provide more reliability in fare transactions over previous modes .

Previous Fare Technologies
[edit | edit source]Cash
[edit | edit source]Prior to the implementation of Go-To Card technology in the Metro Transit system a variety of fare payment methods were used. First, Transit operators have always been able to accept cash. Originally, cash payment would have required operators to make change and collect payments. In time, Metro Transit switched to automated fare-boxes. These fare-boxes do not provide change, but they automatically count both change and bills, allowing passengers to board more quickly than when the driver needed to act as a cashier.[4]
Pre-Paid Fares
[edit | edit source]Tokens
[edit | edit source]Although cash is still accounts for a large share of fare payments on many routes, early efforts were made to transition to pre-paid fares. Tokens were the original pre-payment method accepted by Metro Transit. These tokens could be bought at discount prices in advance and individually given to the operator as payment. With the introduction of the automated fare-boxes tokens changed style a number of times to provide for ease of automated collection. Originally, tokens had holes and those of different monetary value were made of different metals; however this method of differentiation did not work well in the automated fare boxes. Several intermediate designs were tried, with the most recent re-minting occurring in 2004 to make them fully compatible with TBM fare boxes. This compatibility enabled use on the newly opened Hiawatha Light Rail Line (now known as the Blue Line). Today, tokens are largely provided by the social service sector in order to help their patrons return home. Tokens are no longer actively sold to the public by Metro Transit.[5]

Punch Cards
[edit | edit source]Punch cards were a second attempt at pre-payment fare technology. These cards were purchased to cover a set number of rides. Patrons would present the card to the operator, and the operator would punch a hole in the card, reducing the number of available rides remaining by one.
Magnetic Media
[edit | edit source]Eventually, magnetic media replaced the punch-card. Originally magnetic media cards were used to provide 31 day passes and stored value cards. Unfortunately, this technology had many reliability issues including the peeling and stripping of the magnetic media from the back of the card. Additionally, issues frequently occurred when the cards got wet and lost cards were not easy to replace, as owners could not prove they had originally purchased the card and had not used it. Due to these issues with long term use of magnetic media, these cards were largely phased out with the advent of the Go-To card. In fact, at this time Metro Transit still accepts these cards as payment, but they are no longer available for sale as of 2012. Interestingly, magnetic media has obtained a market niche in current transfer and rail tickets. This is largely due to the short duration of service expected from these items; with a shorter service period there is less concern that the magnetic strip will deteriorate.[6]
Market Development of Go-To Card
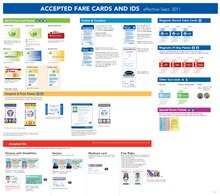
[edit | edit source]Currently, Metro Transit is in the process of phasing out pre-paid magnetic media, with the exception of rail and transfer tickets.[7] As part of this phasing out of magnetic media the Go-To Card has been marketed to more versatile groups, including students, tourists, and commuters.[8] Those who regularly ride the same routes are advised to get 31 day Go-To Passes, generally at discounted rates. Those who regularly ride a variety of routes may prefer a combined stored value and pass Go-To card, which allows for automatic fare upgrades as necessary. Those who will only be in town for a day may purchase a Go-To Lite Card, which provides access to the system for the day and is disposable.[9] A variety of fare-cards accepted by Metro Transit may be seen in Figure 4.

Quantitative Assessment
[edit | edit source]Metro Transit, the chief regional transit operator and planner for the Twin Cities Metropolitan Area, provided the region-wide ridership data shown in Table 1 and Table 2 below.[10] These data are manipulated to create a single yearly value representative of the total market share of Go-To fare payment technologies on Metro Transit operated vehicles. First, the rides taken on suburban transit operator vehicles, represented as ‘oBus S Suburba’ in Table 1, are removed from the yearly Grand Total in Table 1. This is performed via a simple subtraction:
Yearly Totali1=Grand Totali1 -oBus S Suburbai1
The resulting values may then be used comparably in conjunction with those values given as the yearly Grand Total in Table 2. As such, the total market share in a year may be represented as a percentage of the total rides:
GoTo Sharei=100 ×(Yearly Totali1)/(Grand Totali2)
The resulting market shares are shown in Table 3.


In addition to the data in Table 3, it is noted that the Go-To Card became publicly available to Metro Transit users in May 2007 and some users had been testing the technology in 2006 , although no data for either 2006 or 2007 is provided here. However, based on this knowledge, an additional data point can be added for 2006, as the market share for 2006 should have been at or near zero.[11] A regression analysis is performed on the data shown in Table 3 using Equation 2 shown below, in order to estimate the three parameters of a fitted S-Curve, see Equation 1.
Equation 1: S(t)=K/(1+e-b(t-t0 ))
Where:
S(t) is the GoTo Share as a percentage
K is the saturation level of the GoTo Share
t0 is the inflection time (year in which ½ K is achieved)
t is the time (in years)
b is a coefficient
This rearranges as follows in order to facilitate the use of linear regression in MS Excel.
K/S(t) =1+e-b(t-t0 )
K/S(t) -1=e-b(t-t0 )
ln(K/S(t) -1)=ln(e-b(t-t0 ) )
ln(K/S(t) -1)=-b(t-t0 )
ln((K-S(t))/S(t) )=-bt+bt0
ln((S(t))/(K-S(t)))=bt-bt0
Equation 2: ln((S(t))/(K-S(t)))=bt+c
Where:
Equation 3: c= -bt0
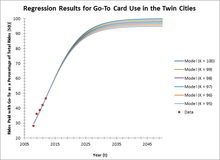
In the course of this analysis it is assumed that Go-To Card fare technology will eventually have the majority of the market shares. As such the regression analysis is performed for integer values of K from 95 to 100 percent. The resulting curves from these analyses are shown in Figure 5, with a zoomed in section surrounding the actual data shown in Figure 6. From these Figures it can be seen that each of these K values fit the data from Table 3 very well; however the resulting curves differ visibly shortly after 2015. In addition, it can be seen that these curves do not approach zero in 2006, as prior knowledge dictates they should.


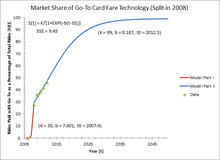
All of these curves show in Figures 5 and 6 seem equally valid, except it is unlikely that Go-To Card technologies will ever receive 100% of the market shares. This is due to the need for the Transit system to continue to accept cash, as it is legal tender, as well as the likelihood that social services will continue to provide their patrons with fare tokens.[12] However, it is anticipated that these two technologies will continue to have decreasing use. As such, for the remaining analysis K is assumed to be 99% for the portion of the life cycle from 2008 onward. In order to model years prior to 2008, a second regression analysis was done on the resulting 2008 prediction and the lack of market share in 2006. For this portion of the model a value of 30%, just over the 2008 prediction was chosen for the K-value. This portion of the curve is justified by recognizing that unlike many transportation systems, the network for the Go-To Card was completely built out before being open to the public, and many users switched shortly after opening from the previous fare card media to Go-To. A second situation, in which the transition between curves occurs in 2009, is also analyzed. In each case after the full regression was complete, the sum of the squared errors between predicted and actual values is calculated. The model with the split occurring in 2008 has a sum of squared errors of 9.45, while the model with the split occurring in 2009 has a sum of squared errors of 47.36. Figures 7 and 8 below illustrate these models. Due to the sum of squared error results, the final choice of model is the one shown in Figure 4 where the split between the two portions of model occurs in 2008. Tables 4 below shows the regression analysis output for the first portion of the curve (before 2008) and Table 5 below shows the regression analysis output for the second portion of the curve (after 2008). In each portion the R-Square is greater than 0.9, indicating a good fit, and the T-statistic for the X-Variable (i.e. b) is greater than 2, indicating statistical significance.


Based on the model shown in Figure 4, the birthing phase appears to have occurred between 2006 and 2008, the growth-development phase began in 2008 and will likely end in approximately 2025, and the system will enter the maturity phase in 2025.
References
[edit | edit source]- ↑ "Minneapolis / St. Paul Becomes First U.S. Transit Authority to Implement Philips' Contactless Smart Card Technology." Smart Card Alliance. Smart Card Alliance, n.d. Web. 05 Nov. 2013.
- ↑ Navick, David S., and Furth G. Peter. "Estimating Passenger Miles, Origin-Destination Patterns, and Loads with Location-Stamped Farebox Data." Transportation Research Record: Journal of the Transportation Research Board 1799.1 (2002): 107-113. Print
- ↑ Kusakabe, Takahiko, Takamasa Iryo, and Yasuo Asakura. "Estimation method for railway passengers' train choice behavior with smart card transaction data." Transportation 37 (2010): 731-749. Print.
- ↑ Capistrant, Mary. "Fare Media Prior To Go-To Card Use at Metro Transit." Personal interview. 06 Nov. 2013.
- ↑ Capistrant, Mary. "Fare Media Prior To Go-To Card Use at Metro Transit." Personal interview. 06 Nov. 2013.
- ↑ Capistrant, Mary. "Fare Media Prior To Go-To Card Use at Metro Transit." Personal interview. 06 Nov. 2013.
- ↑ Capistrant, Mary. "Fare Media Prior To Go-To Card Use at Metro Transit." Personal interview. 06 Nov. 2013.
- ↑ Metro Transit -- Revenue Operations. FARE CARDS AND IDS Effecive Sept. 2012. Minneapolis: Metro Transit, 2012. Print.
- ↑ Metro Transit -- Revenue Operations. FARE CARDS AND IDS Effecive Sept. 2012. Minneapolis: Metro Transit, 2012. Print.
- ↑ Data was provided on November 5, 2013 at 2:20 PM CST in response to a request for both region-wide total ridership by year and region-wide total ridership paid for with a Go-To Card by year from the opening of the Go-To Card system to the current date. Data from 2013 were not included as they were incomplete at the time of the request.
- ↑ Capistrant, Mary. "Fare Media Prior To Go-To Card Use at Metro Transit." Personal interview. 06 Nov. 2013.
- ↑ Capistrant, Mary. "Fare Media Prior To Go-To Card Use at Metro Transit." Personal interview. 06 Nov. 2013.
