Using SPSS and PASW/Computing Variables
Computing variables in SPSS refers to computing with existing variables to create new variables.
One common reasons is creation of a scale measure that combines several existing variables into a single variable, such as to summarize a phenomenon of interest.
In our Genetic Counselors study, a subject investigated was attitude towards (an unpleasant operation, my apologies) abortion. Participants were asked a set of seven questions to learn in what circumstances s/he believed abortion should be allowed. E.g., Do you think a woman should be allowed to obtain an abortion if she has been raped? If she doesn't want any more children? Et cetera. While the individual questions are useful for gaining a sense of the participant's views on whether or not abortion should be legal in specific cases, by combining the variables it is possible to get a better overall measure of opinion on abortion permissiblity. Specifically, we could simply add the number of Yes answers across the seven questions for a sum for each study participant of 0 to 7.
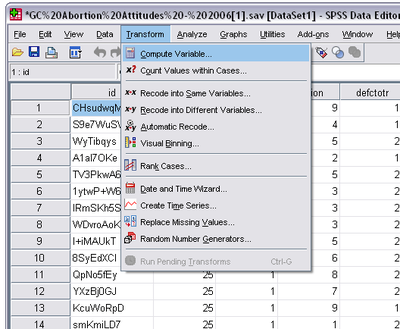
To simultaneously create and compute this variable, which we'll call abscale, click “Transform” → “Compute Variable”:

The resulting window allows you to specify a numeric computation using existing variables:

On the left, under “Target Variable,” is where you name the new variable. Under “Numeric Expression,” you build a formula using the numeric keypad, mathematical operators and functions, and the variables in your data set. Combine these elements as desired. To move a variable into the “Numeric Expression” box, highlight it and click the arrow key.
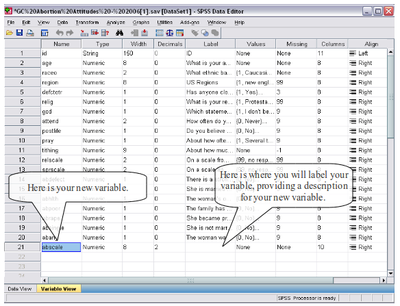
In our example, seven variables are added to create the new scale: abscale. To do this we have only to add the abortion variables, as shown above. Once you're done, click “OK.” Your new variable will then appear in the Data Editor under the “Variable View,” on the ultimate row.

You'll notice that a “Label” value is missing, a void we recommend you always immediately fill with a descriptive label, e.g., "views on abortion; should range from 0 to 7".
In order to ensure that you created the scale accurately, check the frequencies and/or descriptives: click “Analyze” → “Descriptive Statistics” → “Frequencies”:

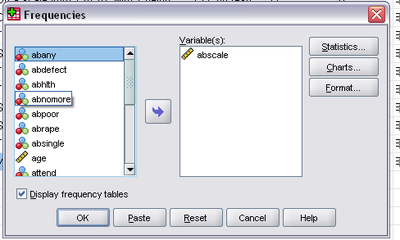
Click your newly created variable, then the arrow to move it into the “Variable(s)” box, and you will get a window like this:

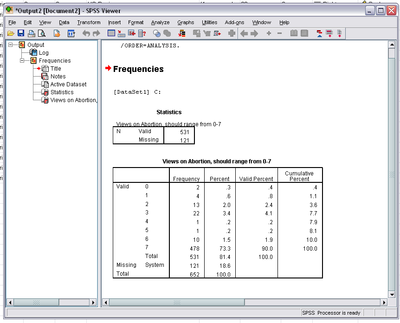
Click OK and your Output Window will show a frequency distribution table for your new variable:

Following these steps, you can realize any new variables math, your data, and interest can conceive, with an assurance that your intentions have been met.
Chapter contributed by Gen Guzman.
