Using SPSS and PASW/Confidence Intervals
Confidence Intervals help us estimate the precision of our statistics relative to the sampled population. Confidence Intervals are a range of values of a parameter, e.g., a mean. We express this interval with a specific degree of confidence. This degree of confidence tells a reader how confident we are that the population parameter falls within our stated interval.
For this example, we will use the variable “sprscale”, representing answers to question “How Spiritual do you consider yourself?” in our example data set made up of genetic counselors. This variable allowed the sample of genetic counselors to rank how spiritual they are on a scale of 1 to 10.
To compute a confidence interval in SPSS, you begin by selecting “Analyze” → “Descriptive Statistics” → “Explore.” Once the “Explore” window pops up, scroll down on the left list until you find “sprscale,” then click on the arrow that will send it to the dependent list:

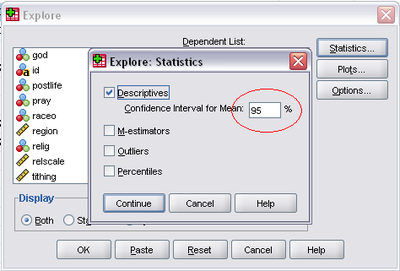
Now, click on “Statistics” to pop up a smaller window:

Check the “Descriptives” box and type in the level of confidence that you would like to use. For this example we'll use 95%. Click “Continue” then “OK.” The Output Window will now pop up with a variety of statistics, including the confidence interval:

The confidence interval we found for how spiritual Genetic Counselors are on a scale of 1 to 10 is 5.99 to 6.36. We interpret this in plain language by saying “We are 95% confident that the true mean spirituality on a scale of 1 to 10 for the population of genetic counselors is between 5.99 and 6.36.”
Page contributed by Lauren Takemoto.
