A-level Physics (Advancing Physics)/Graphs
There are two types of graphs of motion you need to be able to use and understand: distance-time graphs and velocity-time graphs.
Distance-time Graphs
[edit | edit source]
A distance-time graph plots the distance of an object away from a certain point, with time on the x-axis and distance on the y-axis.There are several types of graphs of motion you need to be able to use and understand: distance-time graphs, position-time graphs, and velocity-time graphs.
Position-time Graphs or Displacement - Time Graphs
[edit | edit source]Distance-Time Graphs give you speed, but speed is never negative so you can only have a positive slope in a distance-time graph. Position-Time graphs show displacement, have direction, and from which you can calculate velocity. If we were to imagine the line on the position-time graph to the right as a function f(t), giving an equation for s = f(t), we could differentiate this to gain:
,
where s is displacement, and t is time. By finding f'(t) at any given time t, we can find the rate at which distance is increasing (or decreasing) with respect to t. This is the gradient of the line. A positive gradient means that distance is increasing, and a negative gradient means that distance is decreasing. A gradient of 0 means that the object is stationary. The velocity of the object is the rate of change of its displacement, which is the same as the gradient of the line on a distance-time graph. This is not necessarily the same as the average velocity of the object v:
Here, t and s are the total changes in displacement and time over a certain period - they do not tell you exactly what was happening at any given point in time.
Velocity-time Graphs
[edit | edit source]
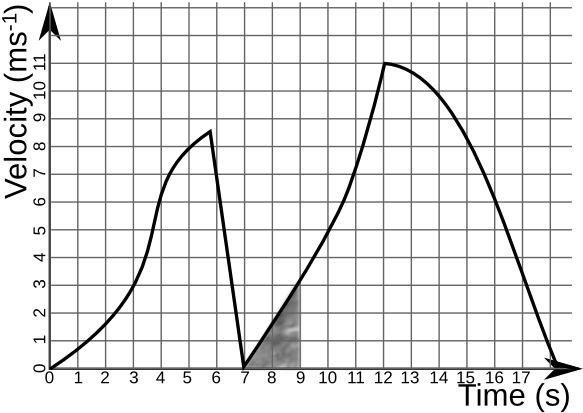
A velocity-time graph plots the velocity of an object, relative to a certain point, with time on the x-axis and velocity on the y-axis. We already know that velocity is the gradient (derivative) of the distance function. Since integration is the inverse process to differentiation, if we have a velocity-time graph and wish to know the distance travelled between two points in time, we can find the area under the graph between those two points in time. In general:
If
where v is velocity (in ms−1), t is time (in s), and s is the distance travelled (in m) between two points in time t1 and t2.
Also, by differentiation, we know that the gradient (or derivative of v = f(t)) is equal to the acceleration of the object at any given point in time (in ms−2) since:
Questions
[edit | edit source]1. In the following distance-time graph, what is the velocity 4 seconds after the beginning of the object's journey?

2a)Describe this person's movements.
2b)What is the velocity at 12 seconds?
3. In the following velocity-time graph, how far does the object travel between 7 and 9 seconds?

4. What is the object's acceleration at 8 seconds?
5. A car travels at 10ms−1 for 5 minutes in a straight line, and then returns to its original location over the next 4 minutes, travelling at a constant velocity. Draw a distance-time graph showing the distance the car has travelled from its original location.
6. Draw the velocity-time graph for the above situation.
The following question is more difficult than anything you will be given, but have a go anyway:
7. The velocity of a ball is related to the time since it was thrown by the equation . How far has the ball travelled after 2 seconds?


