A-level Physics (Advancing Physics)/Graphs/Worked Solutions
1. In the following distance-time graph, what is the velocity 4 seconds after the beginning of the object's journey?

At this point, the graph is a straight line. So:
2. What is the velocity at 12 seconds?
Approximately, there is a rough straight line at this point. The object is travelling towards home 2 ms−1 each second (look at the previous second, for example). So, its velocity is -2 ms−1.
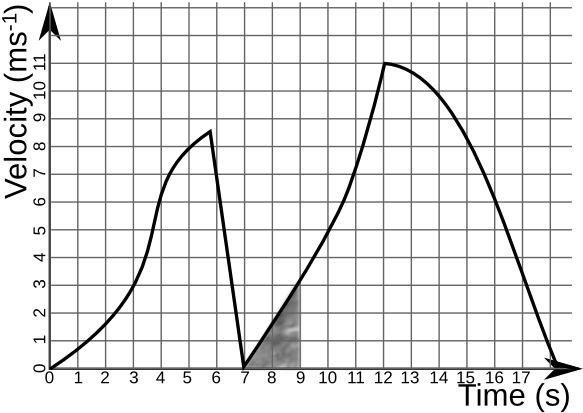
3. In the following velocity-time graph, how far does the object travel between 7 and 9 seconds?

Distance travelled is equal to the area under the graph. Between 7 and 9 seconds, this is the shaded area of the graph. So, calculate the area of the triangle:
4. What is the object's acceleration at 8 seconds?
There is a straight line between 7 and 9 seconds which we can use to answer this question. The acceleration is equal to the gradient of the graph, so:
5. A car travels at 10ms−1 for 5 minutes in a straight line, and then returns to its original location over the next 4 minutes, travelling at a constant velocity. Draw a distance-time graph showing the distance the car has travelled from its original location.
10ms−1 = 600 metres / minute.
6. Draw the velocity-time graph for the above situation.
The velocity from 0-5s is 10ms−1. The velocity from 5-9s is:
7. The velocity of a ball is related to the time since it was thrown by the equation . How far has the ball travelled after 2 seconds?


![{\displaystyle s=\int _{t_{1}}^{t_{2}}f(t)\,dt=\int _{0}^{2}30-9.8t\,dt=[30t-4.9t^{2}]_{0}^{2}=30(2)-4.9(2^{2})-30(0)+4.9(0^{2})=60-19.6=40.4{\mbox{ m}}}](https://wikimedia.org/api/rest_v1/media/math/render/svg/c480eebc149454ac5cb3dc1224e0e218014f8d9c)